Over and under goals: how AI predicts goal totals

Why totals markets are the smartest place to start
Over and under goals markets look simple: will the match have more or fewer goals than a line like 2.5. In reality, totals are one of the most information-dense football markets because they reflect how a match is likely to be played. A 1x2 price is influenced heavily by team strength. A totals price is influenced by tempo, chance quality, game state incentives, and tactical matchups. That is exactly why AI models often perform well on totals: the market is asking a question that aligns with what data describes best.
Goals are rare, but chances are not. If you can estimate how many quality chances each team is likely to create and concede, you can build a strong forecast of the match’s goal distribution. The best totals models are not trying to guess a final score. They are estimating the full probability distribution of 0, 1, 2, 3, 4+ goals and then mapping those probabilities onto the betting lines.
How totals betting lines work
The most common line is 2.5 goals. Over 2.5 wins if the match ends with 3 or more goals. Under 2.5 wins if the match ends with 0, 1, or 2 goals. Lines like 1.5, 3.5, and 4.5 work the same way. Asian goal lines add more nuance with half wins and half losses, but the core idea is identical: you are betting on the total number of goals in the match, not who wins.
Why 2.5 is a special line
2.5 sits close to the typical average goal expectation in many leagues, so it is often the most liquid and the most efficiently priced. That makes it a good place to evaluate a model honestly. If your AI system cannot compete on the most liquid totals lines, it is unlikely to perform well in niche props where variance and margin are higher.
The core idea behind AI totals prediction
At a high level, AI predicts goal totals by estimating how many goals each team is expected to score, then converting that expectation into a probability distribution. There are different ways to do this, but strong systems usually combine 3 layers:
1) a team strength layer (attack and defense quality)
2) a matchup layer (style interaction, tempo, and chance creation patterns)
3) a distribution layer (how to turn expected goals into probabilities for each goal count)
Expected goals is the foundation, not the whole story
xG is a natural base for totals because it measures chance quality. If a match is likely to produce high-quality chances, totals should be higher. If it is likely to be low-tempo and low-quality, totals should be lower. However, xG is not enough on its own. Totals markets are sensitive to finishing, goalkeeping, game state, and tactical incentives. That is why modern AI models go beyond raw xG and build richer features around chance type, pace, and stability.
Inputs AI models use to predict total goals
xG for and xG against
The simplest predictive features are how much xG a team creates and concedes. A team that consistently creates 1.80 xG and concedes 1.60 xG tends to play higher-event matches than a team that creates 1.10 and concedes 0.90. Totals models often use rolling windows, such as the last 5 or last 10 matches, blended with season-to-date, to balance responsiveness and stability.
Shot volume and shot quality mix
2 teams can have the same xG but very different profiles. One might create a few high-quality chances and take few shots. Another might take many low-quality shots. This matters because shot volume increases the chance of deflections, rebounds, and chaotic sequences that lead to goals. AI models often include shot count, big-chance rate, box touches, and the share of xG coming from open play vs set pieces.
Tempo and possession dynamics
Tempo is a hidden driver of totals. Fast transition matches can produce more high-quality chances than slow possession games that end in low-quality shots. AI models estimate tempo using possession speed, directness, transition frequency, and pressing intensity. These features help predict whether a match will be open or controlled.
Team styles and matchup interaction
Matchups matter. A high press against a weak build-up team can create turnovers in dangerous areas, increasing goal probability. A low block against a slow possession team can suppress open-play chances and push the match toward set pieces. AI models capture this by learning interactions between team style vectors: pressing vs press resistance, transition attack vs rest defense, crossing reliance vs aerial defense quality.
Game state and incentives
Totals are shaped by incentives. A team happy with a draw may slow the game. A team chasing a result may take more risks and open the match. Cup ties, 2-legged fixtures, and group-stage situations can all change risk appetite. AI models include context variables such as competition type, stage, and sometimes table situation proxies, because these change how teams behave after the first goal.
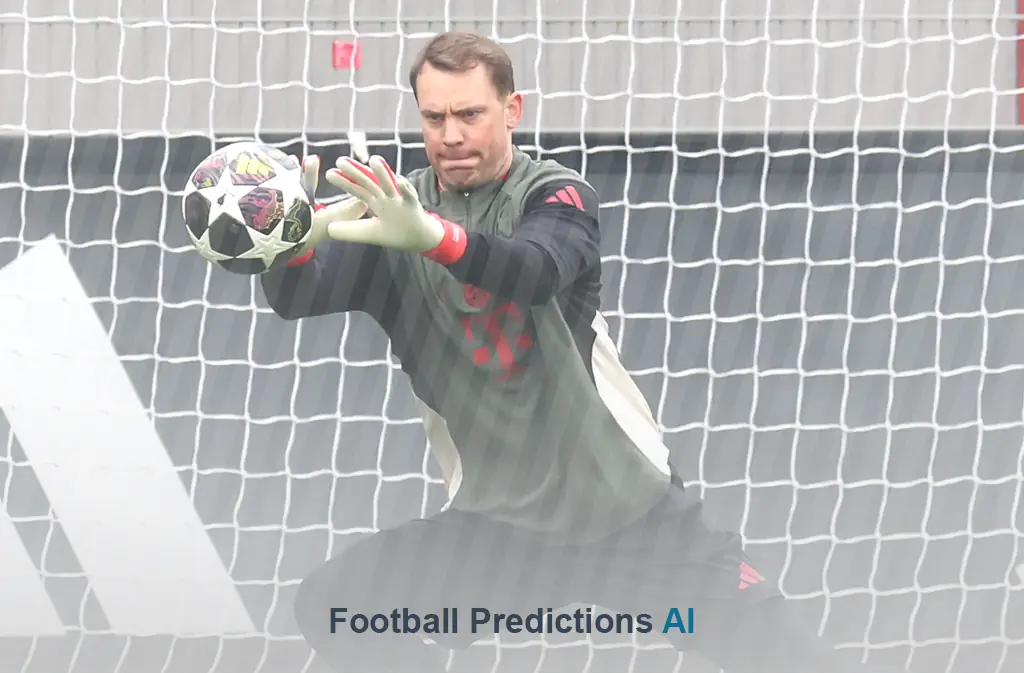
Lineups, injuries, and goalkeepers
A missing center back or a backup goalkeeper can move totals significantly. The problem is timing: many lineup signals arrive late. Serious systems store snapshot features by time horizon, so an early prediction model does not accidentally use late lineup confirmations. Goalkeeper impact is especially important because saving performance can swing totals even when xG is stable.
From expected goals to goal totals probabilities
Once a model estimates expected goals for each team, it needs to convert that into probabilities of 0, 1, 2, 3, 4+ total goals. A classic approach uses Poisson assumptions for goals scored by each team. More modern systems relax those assumptions by using negative binomial distributions, mixture models, or direct simulation. The objective is the same: generate a realistic distribution that reflects uncertainty.
Why distribution choice matters
Football goals are not perfectly Poisson. Match state changes behavior, red cards create discontinuities, and teams are not independent. A naive distribution can underestimate extreme outcomes like 4-3 or 0-0 in certain contexts. AI models improve by learning when variance increases, such as in matches between high-transition teams or matches where one team is likely to chase aggressively.
Making the model usable: mapping probabilities to betting lines
Once you have a probability distribution for total goals, betting lines become simple math. Over 2.5 is the probability of total goals being 3 or more. Under 2.5 is the probability of 2 or fewer. Over 3.5 is the probability of 4 or more, and so on. Asian lines require splitting outcomes, but the core probabilities still come from the distribution.
If you want a practical view of how these markets are presented and how predictions are framed for users, see over under predictions, which is a useful reference point for totals-focused forecasting and market interpretation.
How to judge whether an AI totals model is good
Calibration, not just accuracy
Totals predictions are probabilities. If your model says over 2.5 hits 55% of the time in a set of matches, it should actually hit close to 55% across a large sample. Many models fail because they are overconfident. Calibration is a professional requirement, not an optional bonus.
Performance across league styles
Some leagues are higher tempo, some are more tactical, some have different refereeing patterns. A strong model should adapt without learning league-specific noise. This is where opponent adjustment and style features matter. If your model only works in one league, it is not robust.
Honest evaluation by time horizon
If you publish predictions early, test against early odds snapshots. If you publish late, test against late snapshots. Comparing an early model to closing odds is a common mistake that inflates performance. Proper evaluation respects what was known at prediction time.
Common mistakes in totals predictions
Overreacting to recent scorelines
A 4-0 does not automatically mean “over team.” It might have been driven by a red card or finishing variance. Totals models should rely on underlying chance creation and style, not on last-match scorelines.
Ignoring the goalkeeper and set piece layer
Goalkeepers and set pieces are high leverage in totals. A weak set-piece defense can turn a low-event match into an over. A top goalkeeper can keep an over-looking match under. Good models include these layers, even if the signals are noisy.
Assuming totals are stable across match states
Once a goal is scored, behavior changes. Some matches slow down. Others explode. Models that ignore game state transitions can miss the tail outcomes that define totals profitability.
The bottom line: totals are a probability distribution problem
AI predicts over and under goals well when it treats the match as a chance-generation system, not as a narrative. The best models combine xG with tempo, style interaction, lineup context, and realistic goal distributions. Then they map those probabilities onto betting lines with disciplined calibration and honest evaluation.
If you build totals predictions this way, you do not need to chase exact scores. You need to understand the shape of the match: how many chances, what quality, what pace, and what variance. That is exactly what data and AI are best at describing.